This Level Could Be Crucial For Bitcoin, PoW Pricing Model Suggests
- Posted on January 30, 2023
- News
- By Mark Otto
- 330 Views

The Bitcoin difficulty per issuance, a proof-of-work (PoW) pricing model, might provide hints about the following crucial level BTC would have to clear.
Bitcoin Approaches Difficulty Per Issuance Model 2.0 Level
As pointed out by an analyst on Twitter, the BTC price is almost double the cost of production now. The “difficulty per issuance” is a Bitcoin PoW pricing model based on two metrics: the mining difficulty and the issuance.
The mining difficulty is a mechanism of the Bitcoin network that sets the computing difficulty for miners to mint new coins and insert blocks on the chain. The difficulty exists because the BTC network was configured to keep its supply production around a constant value.
Whenever the Bitcoin hashrate, a measure of the total amount of computing power connected to the blockchain, changes its value, the rate at which miners produce new blocks also fluctuates. As the network is set to prevent this, it adjusts the difficulty exactly as much as is needed to counter these fluctuations.
Because the difficulty is dependent on the hashrate in this way, it encapsulates all the mining-related expenses that miners incur and can thus be used to estimate production costs.
The difficulty per issuance model is based on this idea. To calculate the cost of 1 BTC, the model divides the difficulty term with the “issuance,” the total amount of new coins added to the circulating supply.
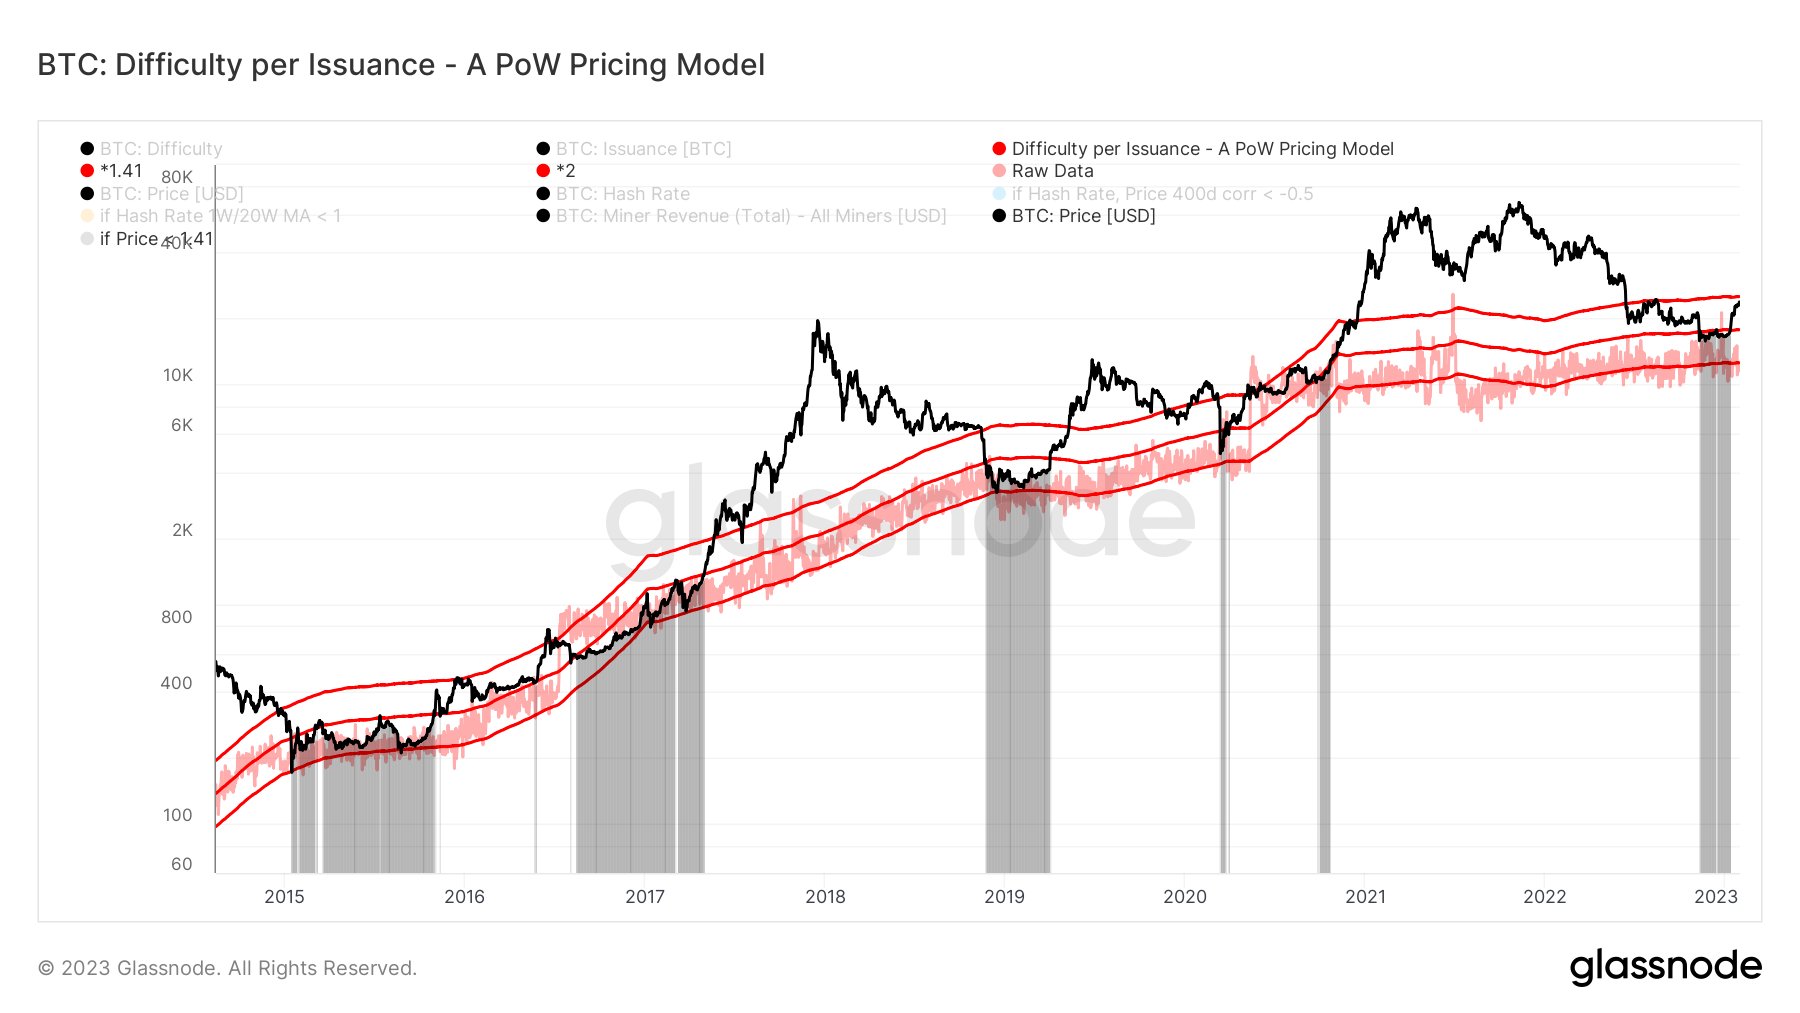
Now, here is a chart that shows the three essential levels of this model and where Bitcoin stands in relation to them:
As displayed in the above graph, the Bitcoin price was under the difficulty per issuance 1.41 level a while back (the middle line). This level represents a kind of average cost of production for the BTC miners.
The bottom line gives a lower bound estimation for the cost of production, while the top line gives an upper bound. The chart shows that BTC never touched the lower bound in this cycle.
With the latest rally, BTC has broken above the 1.41 level and is now approaching the 2.0 level (the upper bound). In the past, Bitcoin has remained between these two levels for extended periods during a few different instances.
Usually, bull rallies have taken place after Bitcoin has successfully broken out of this zone in the past. So, if the crypto’s price manages to go beyond this level, it might be a positive sign for investors.
However, the coin being rejected from the difficulty per issuance 2.0 level is just as real a possibility as there is historical precedence for it. Now it remains to be seen how the price will react once it retests this line (assuming it even does one in this rally).
BTC Price
At the time of writing, Bitcoin is trading around $23,100, up 1% in the last week.

Source: NewsBTC


