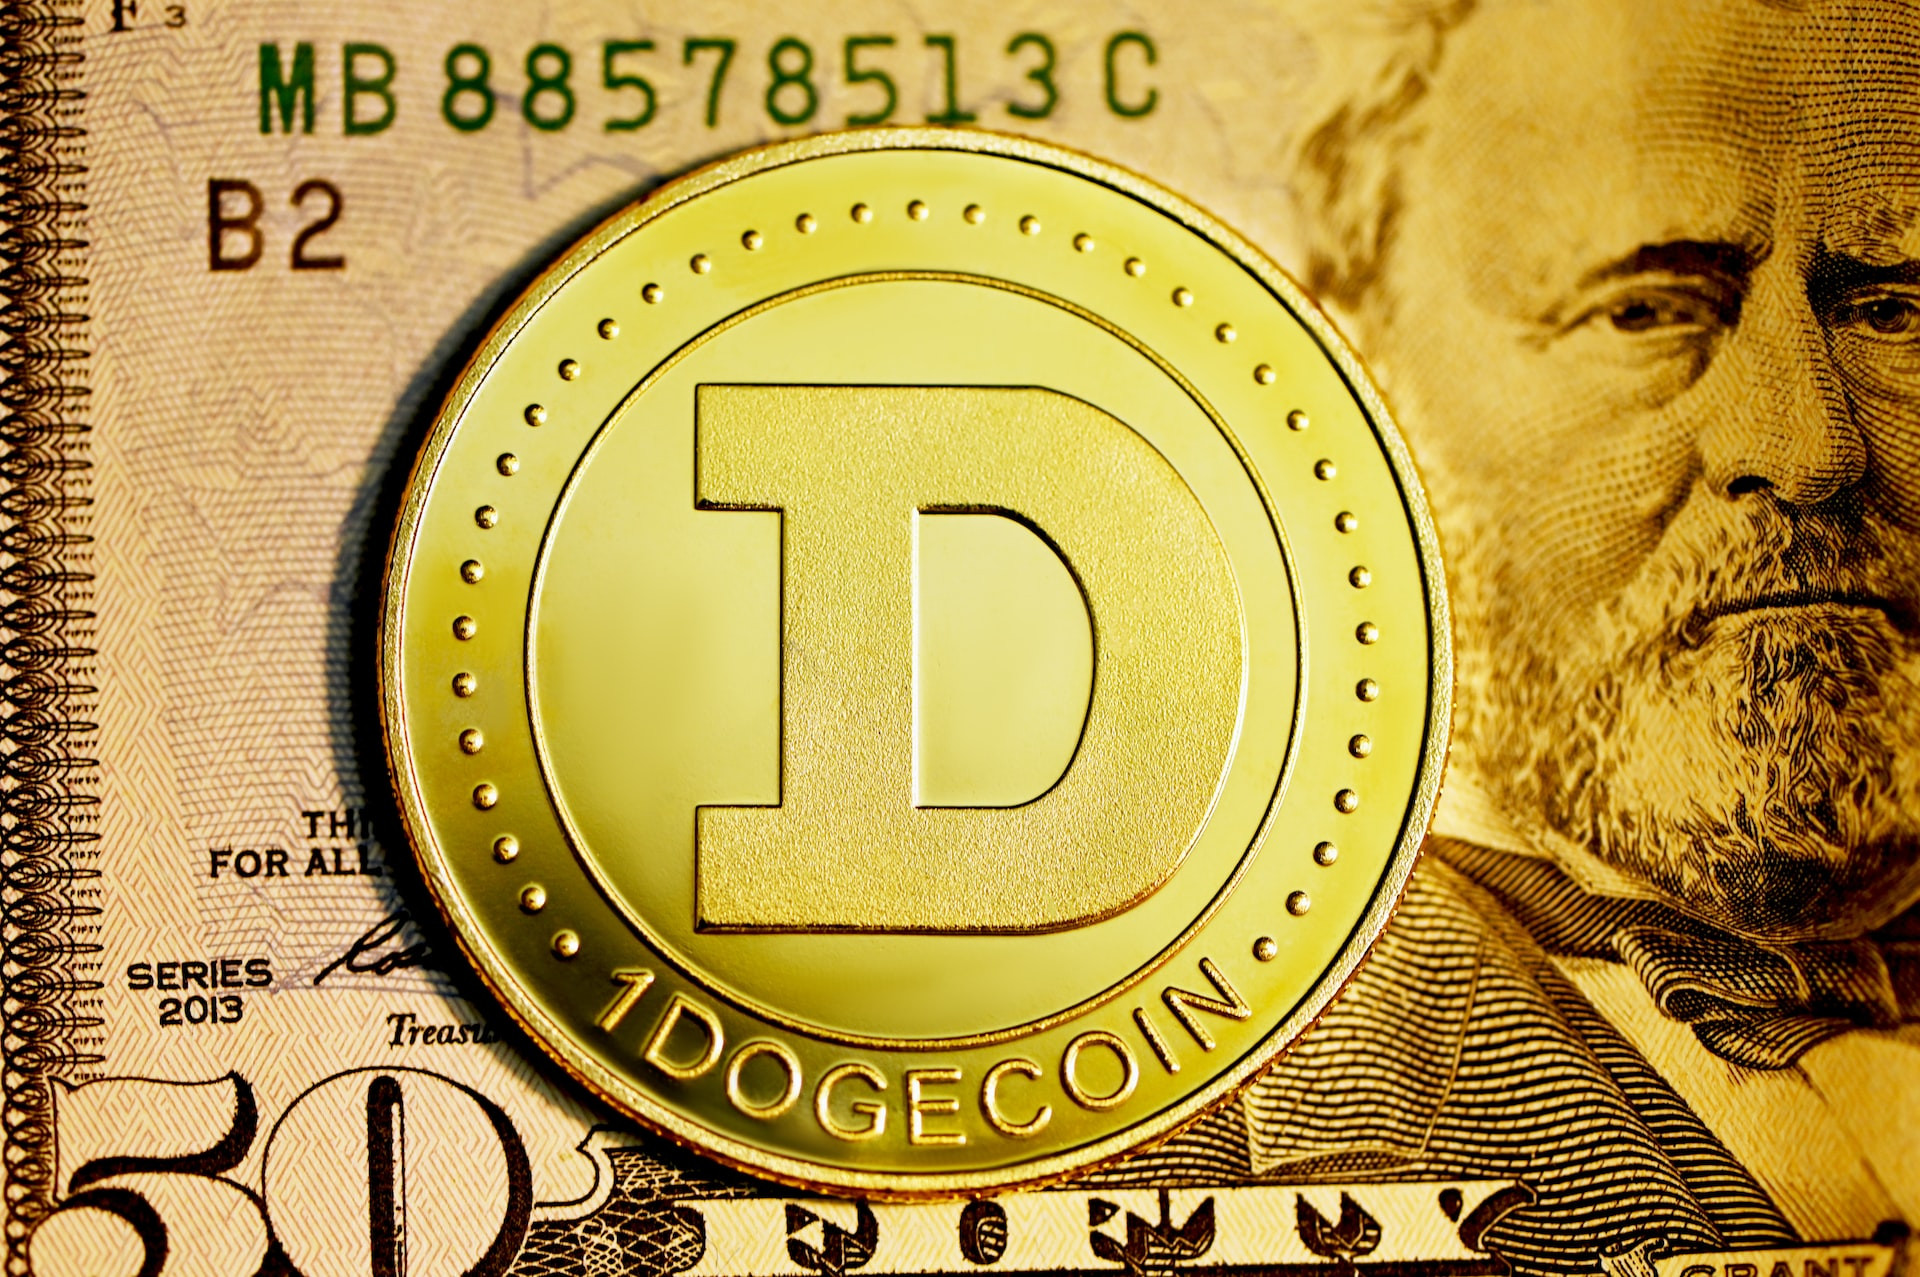
Dogecoin Price Falls, Is It A Wise Idea To Short?
- Posted on January 6, 2023
- News
- By Mark Otto
- 133 Views

The Dogecoin price has remained motionless over the past several weeks. In recent times, due to constant lateral trading, DOGE lost the $0.072 support line. Over the past 24 hours, the coin has dipped nearly 3% on its chart.
The meme coin has only moved 0.7% in the last week. As Bitcoin started to act wobbly on its chart, many altcoins that had made gains started to retrace on their respective charts. Technical indicators, however, suggest that the asset might register gains over the next trading session.
The coin has registered a fall in demand on the chart, but that is not supposed to last for long. Although DOGE had pierced through several support lines, the coin could soon make up for the loss. The crucial resistance mark for Dogecoin stood at $0.078.
Buying pressure has to return to the market for Dogecoin price to target a move above $0.078 and attempt to trade near $0.080. Touching the $0.080 mark will invalidate the bearish thesis for a significant period of time. The market capitalization of Dogecoin did not indicate that bears were crawling back into the market.
Dogecoin Price Analysis: One-Day Chart

DOGE was selling at $0.070 at press time. The coin was secured on top of its $0.066 support line, but a fall from the $0.066 level will ensure that the bears are completely back. Overhead resistance for the coin stood at $0.072 and then at $0.078.
As far as the indicators are concerned, the Dogecoin price shall not have too much difficulty moving above the $0.072 level, but the $0.078 price mark will prove to be a tough resistance level for Dogecoin, causing the coin to fall in value.
In regard to the shorting opportunity, it is better to wait as the Dogecoin price is eyeing the next resistance level. Shorting at the moment will cause further losses for traders. The amount of Dogecoin traded in the last session fell, indicating a bearish bias.
Technical Analysis

A fall in accumulation on the daily chart has caused Dogecoin buyers to fade from the market. The Relative Strength Index was below the 40 mark, indicating that sellers were stronger than buyers in the market.
Dogecoin’s price was below the 20-Simple Moving Average line, which again reiterated that sellers were driving the price momentum in the market. Despite that, an increase in demand will push the meme coin to rise above the 200-SMA (green) line, which is considered extremely bullish.
Related Reading: Ethereum Price Consolidates Gains, Why ETH Could Start Another Increase
Over the past trading sessions, whenever the Dogecoin price rose above the 200-SMA line, the coin rallied. This is why shorting the asset right now would not be a wise idea.

In view of the price rising over the next few trading sessions, the technical indicators have displayed buy signals. Contrary to shorting, the asset has presented an entry point for traders. The Moving Average Convergence Divergence shows the price momentum; it formed green signal bars, indicating a buy signal for the coin.
Similarly, the Awesome Oscillator suggests the price trend and direction, while the indicator also displayed green histograms tied to buy signals. The buy signals translate to the price going up in the upcoming sessions.
Source: NewsBTC


