Bitcoin Volatility Ahead? Open Interest Registers Sharp Jump
- Posted on January 30, 2023
- News
- By Mark Otto
- 227 Views

On-chain data shows Bitcoin’s open interest has sharply gone up recently, a sign that the crypto’s price may be heading toward more volatility.
Bitcoin Open Interest Has Made A Huge Jump Of 8.3% Over Past Day
As pointed out by an analyst in a CryptoQuant post, this increase in open interest is the largest observed during the past three months. The “open interest” is an indicator that measures the total amount of Bitcoin futures contracts that are currently open on derivative exchanges. The metric accounts for both short and long contracts.
When the value of this metric goes up, it means users are opening new positions on the futures market right now. As leverage usually goes up with investors opening new contracts, this kind of trend can lead to the price of the crypto becoming more volatile.
On the other hand, decreasing values of the indicator imply investors are closing up their positions at the moment. Especially sharp drawdowns suggest mass liquidations have just taken place in the market.
Naturally, when the open interest comes down to low enough values, the price tends to become more stable as there isn’t much leverage present anymore.
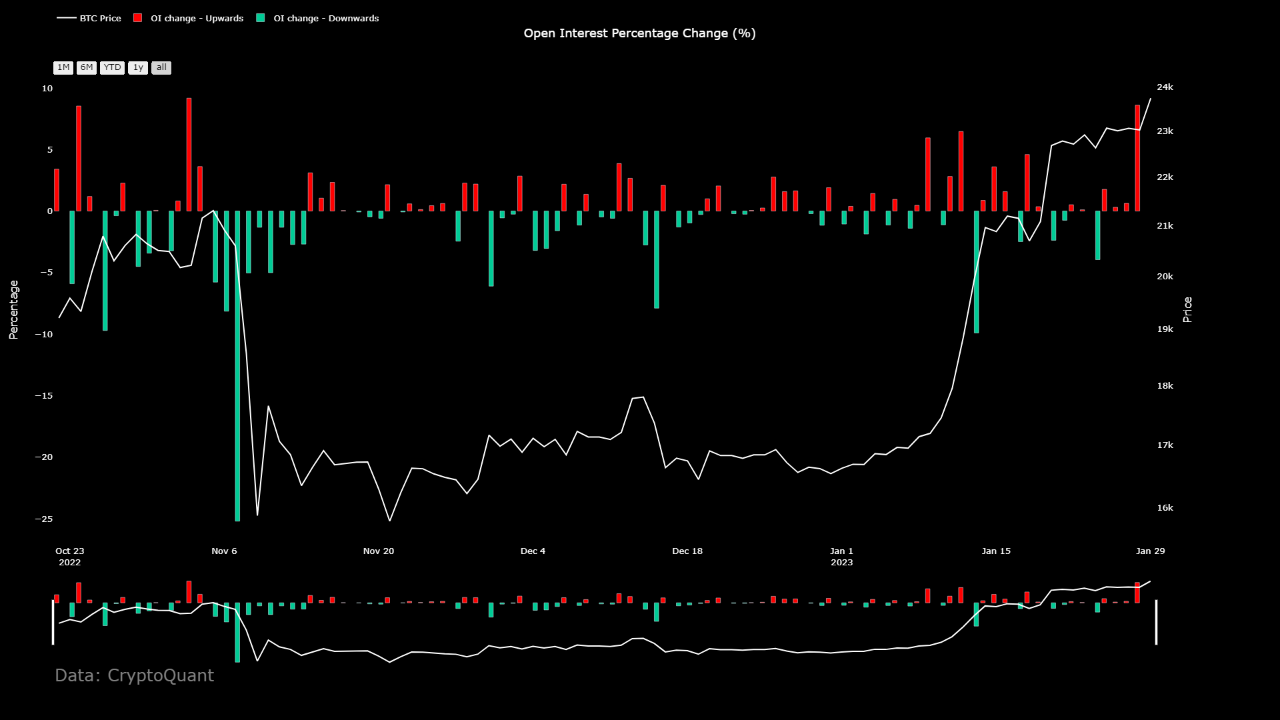
Now, here is a chart that shows the trend in the daily percentage change of the Bitcoin open interest over the last few months:

As displayed in the above graph, the Bitcoin open interest seems to have gone through a very large positive change recently. In this spike, the indicator’s value increased by $700 million, which represented a percentage change of 8.3%, the highest observed during the last three months.
This could signal that volatility may be coming soon for the crypto. However, it’s currently unclear in which direction this new volatility might end up taking the price in.
From the chart, it’s apparent that earlier during the current Bitcoin rally, the open interest saw a large spike (obviously smaller than the current one), and only a day later, a sharp negative spike was seen as Bitcoin’s price rapidly climbed.
This means that the price increase then was fueled by a short squeeze. A “squeeze” takes place when mass liquidations take place at once due to a sharp move in the price.
Such liquidations only amplify the price move further, leading to even more positions being liquidated. In this way, liquidations can cascade together during a squeeze event. Squeezes are the reason why high open interest periods generally introduce more volatility to the price.
It would appear that when the rally started, a large number of investors opened short positions, believing that the price increase wouldn’t last too long. But as their bet failed, their positions being liquidated only fueled the rally further.
It now remains to be seen whether a similar event will also follow this open interest increase, or if a long squeeze will occur this time instead.
BTC Price
At the time of writing, Bitcoin is trading around $23,100, up 1% in the last week.

Source: NewsBTC


