Bitcoin Bullish Signal? Small Investors Show Rapid Accumulation
- Posted on December 26, 2022
- News
- By Mark Otto
- 163 Views

On-chain data shows small Bitcoin holders have accumulated recently while whale holdings have decreased, a sign that may be bullish in the long term.
Bitcoin Investors With 0-1,000 Coins Have Increased Their Holdings Recently
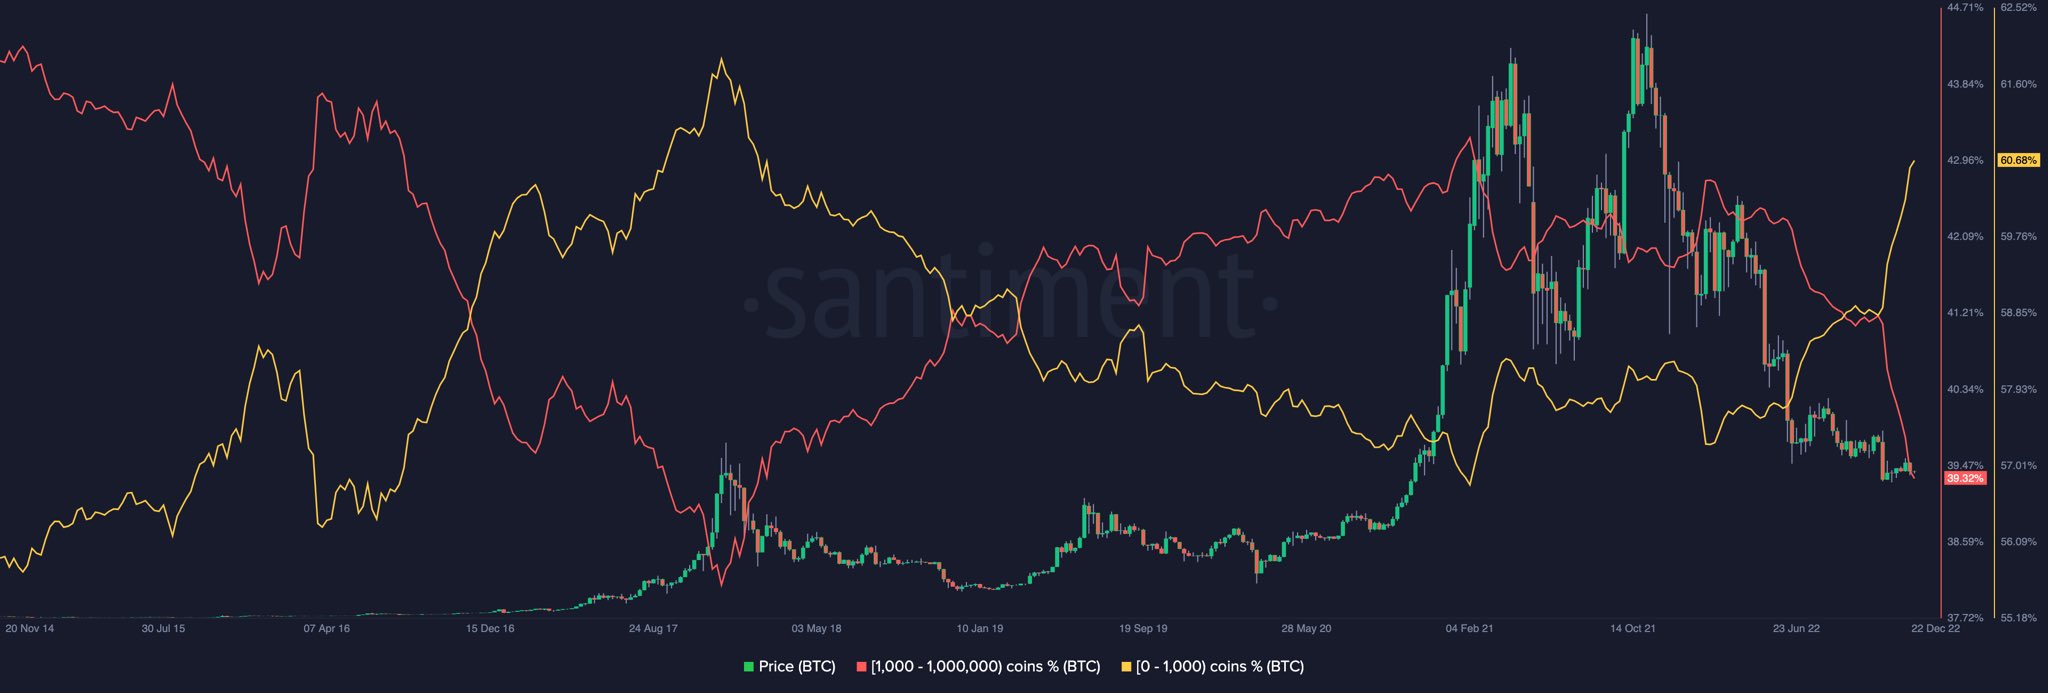
As a Twitter user has pointed out using data from Santiment, holders with wallet amounts in the 0-1,000 coins range have aggressively accumulated at recent lows. The relevant indicator here is the “Bitcoin Supply Distribution,” which tells us which wallet groups are holding what percentage of the total supply right now.
Wallets (or more simply, holders) are divided into wallet bands based on the number of coins they are holding at the moment. For example, the 1-10 coins cohort includes all addresses that are currently carrying at least 1 and at most 10 BTC. The Supply Distribution metric for this group measures the collective balance of all the wallets falling inside this range.
Now, here is a chart that shows the trend in the Bitcoin Supply Distribution data for the 0-1,000 coins and 1,000-1,000,000 coins bands:
As you can see above, the Bitcoin Supply Distribution curve for the 1,000-1,000,000 coins band has observed a sharp decline recently. The holders belonging to this group are the whales, which means that the percentage of the supply held by these humongous holders has been going down, suggesting that they have been capitulating during this deep bear market.
The supply share held by the 0-1,000 coins group, on the other hand, has rapidly increased recently, implying that retail investors have been accumulating large amounts during the recent lows in the price of the asset.
From the chart, it’s apparent that such a pattern was also seen during the 2018/2019 bear market, albeit the scale of movement from both these groups was much smaller. Interestingly, this trend only formed in that bear after the cyclical low was already in for BTC.
Thus, if history is anything to go by, this recent accumulation from the 0-1,000 coins group could help Bitcoin form the bottom for the current cycle (if it’s not already in), and therefore reverse the coin towards a bullish trend in the long term.
BTC Price
At the time of writing, Bitcoin’s price floats around $16,800, up 1% in the last seven days. Over the past month, the crypto has gained 2% in value.

Source: NewsBTC


