Bitcoin Bullish Signal: Exchange Whale Ratio Continues To Decline
- Posted on January 2, 2023
- News
- By Mark Otto
- 170 Views

On-chain data shows the Bitcoin exchange whale ratio has continued to decline recently, a sign that may prove to be bullish for the crypto’s price.
Bitcoin Exchange Whale Ratio 72-Hour MA Has Been Going Down Recently
As pointed out by an analyst in a CryptoQuant post, the bitcoin exchange ratio on a 72-hour moving average has been on a decline. The “exchange whale ratio” is an indicator that measures the ratio between the sum of the top 10 Bitcoin transactions to exchanges and the total exchange inflow.
Since the ten largest deposits to exchanges are usually from the whales, this metric tells us what part of the total exchange inflows is being contributed by these humongous holders. Thus, when the value of the indicator is high, it means whales are making up a high part of the inflows right now.
As one of the main reasons investors deposit to exchanges is for selling purposes, this kind of trend can be a sign of heavy dumping from this cohort, and could therefore be bearish for the value of the crypto. On the other hand, low values of the ratio imply whales aren’t making a disproportionate contribution to the inflows currently, which could be bullish for the price of BTC.
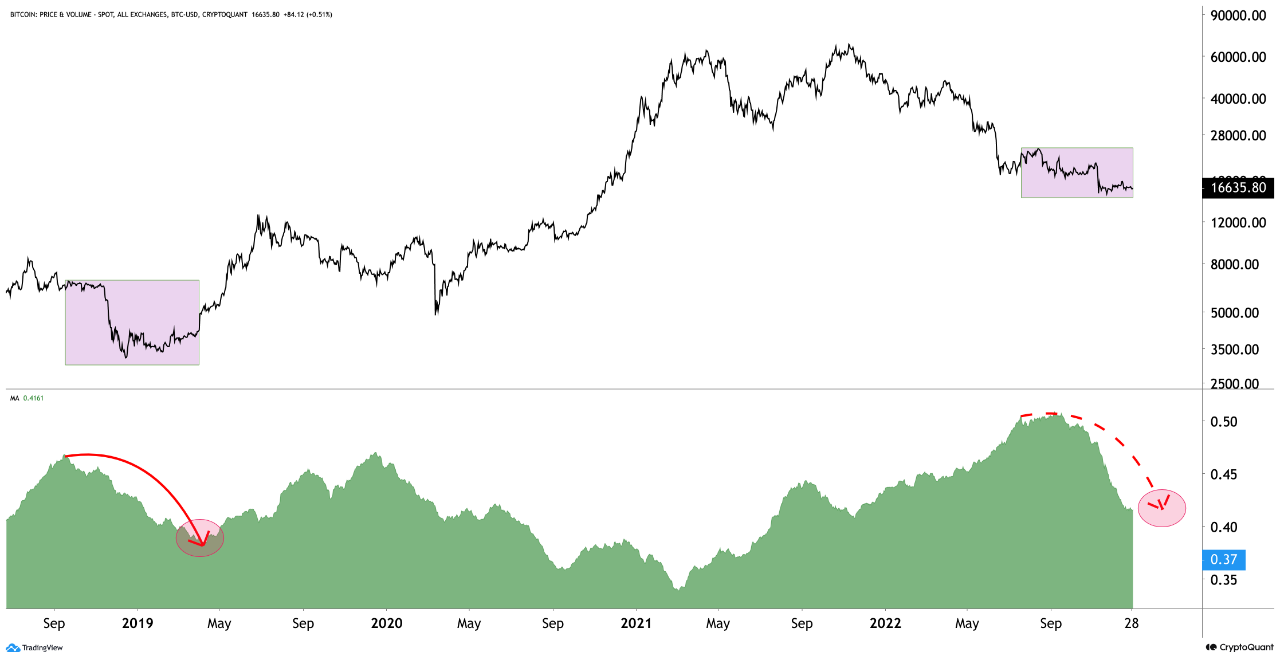
Now, here is a chart that shows the trend in the 72-hour moving average (MA) Bitcoin exchange whale ratio over the last few years:

As the above graph displays, the 72-hour MA Bitcoin exchange whale ratio was rising in the first half of the year, showing that whales were increasingly dumping the coin as the price plummeted. By Q3 2022, however, the metric observed a slowdown, and in the last few months of the year, the trend had reversed and the indicator started a downtrend.
This implies that whales have been dropping their selling pressure recently. Interestingly, a similar pattern was also seen in the period between late 2018 and early 2019, as can be seen from the chart. In that cycle’s bear market, this trend in the whale ratio coincided with the price bottoming out.
Once the whale ratio had finished its decline in that bear market, Bitcoin finally began to see some upwards momentum. If the same trend follows this time as well, then the current downtrend of the whale ratio could also lead to some bullish relief for BTC investors.
BTC Price
At the time of writing, Bitcoin’s price floats around $16,700, down 1% in the last week.

Source: Bitcoinist.com


